DiversityDescriptionsGridEditor
DiversityDescriptions Grid Editor
Required databases
- DiversityDescriptions (see Databases for further information).
Range of functions
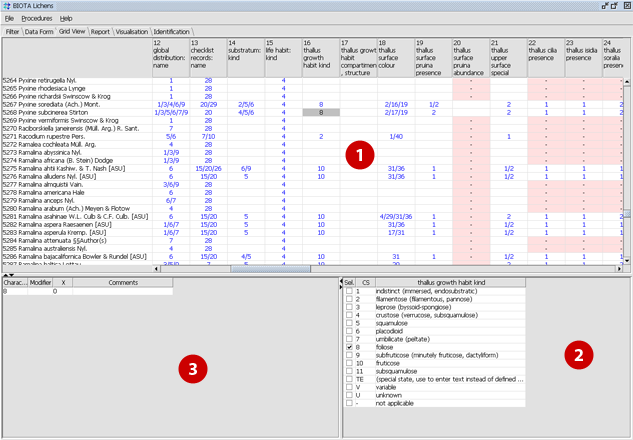
The GUI of the DiversityDescriptions Grid Editor is separated into three frames:- Grid view of items and their features (character states)
- Selection of character states
- Input form for numeric data and comments

The DiversityDescriptions Grid Editor can display the data of databases that are compatible with the DiversityDescription model. Furthermore you can edit the data very easily. Each row in the grid view (1) shows one dataset/item. The taxonomic Name of the item is shown in the first column. All subsequent coumns display the characters that exist in your project. Each cell shows the selected character state(s) of an item. If you click on a cell, you can enter on ore more character states for each item.
Versions
Example
Standalone - Applet - Plugin
| standalone | - |
| applet | - |
| plugin | + |
Download classes
Edit page
Add Comment
Attach File
Page Info
My Prefs
Create group
DiversityNavigator Version 0.97.21
This page (revision-1) last changed on
16:31 14-Feb-2007
by unknown.
